Did your hardiness zone change?
There’s big news in the gardening world. If you pay any attention to the internet you probably already know about it, but if not, allow us to break the news.
The United States Department of Agriculture (USDA) released a new Plant Hardiness Zone Map last month.
At first glance, the new map might not look all that different from the previous version from 2012, but don’t be fooled—these small shifts are far from insignificant. Roughly half of the United States moved into a warmer half-zone or zone, according to the USDA.
Although some are attributing the adjustments to climate change, the USDA cautions anyone from making too big a leap, citing more advanced technology and more data-collecting stations as the prime reasons for the shift.
Still, other growers defend their original hardiness zone placement, arguing that their winters haven’t actually gotten warmer—only more variable with more unpredictable temperature swings.
There’s so much chatter among gardeners who want to understand exactly why their seeds will or will not grow that we wanted to dig deeper and share what else people are saying about the current map, as well as what to do with this new information.
Understanding the USDA Plant Hardiness Zone Map
What are hardiness zones?
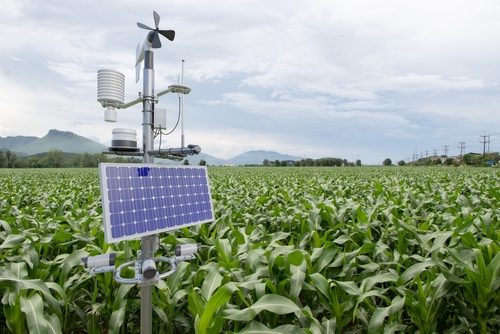
Hardiness zones, also known as planting or growing zones, refer to geographic locations defined by average lowest winter temperatures. Since 1960, the USDA has been gathering weather data and compiling this information into a visual.
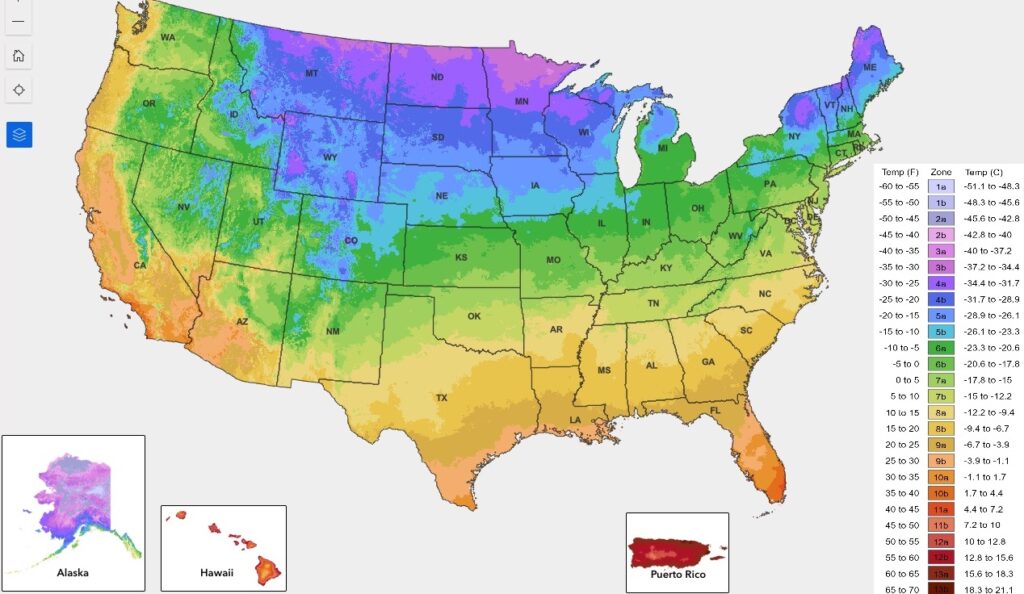
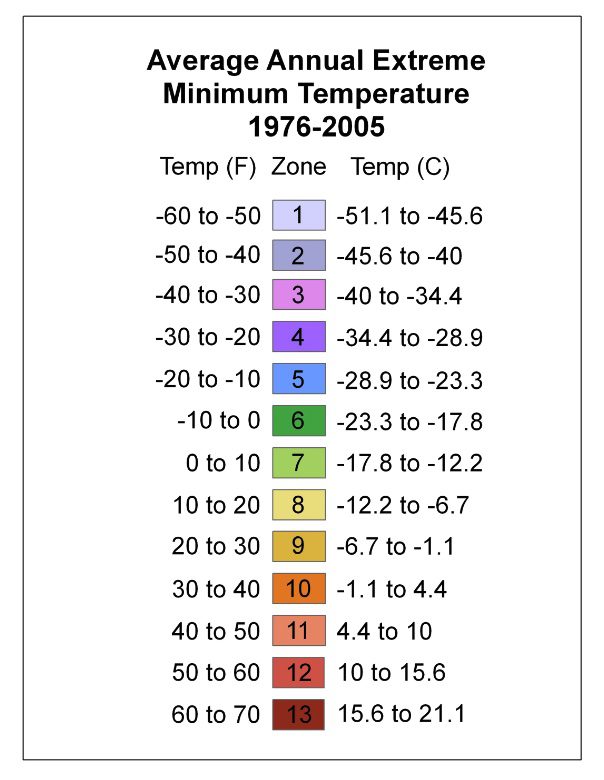
The USDA Plant Hardiness Zone Map (PHZM) divides North America into 13 different zones, that range in average lowest winter temperature from -60 degrees Fahrenheit (Zone 1) to 70 degrees Fahrenheit (Zone 13). There is a 10-degree difference between zones, and each zone is further broken down into five-degree increments, marked a and b (a is slightly colder than b).
Interior Alaska houses the coldest hardiness zone, and Puerto Rico boasts the warmest. Based on the 2023 PHZM, the contiguous United States ranges from zone 3a in the North and parts of the Rockies, to zone 11a in the southernmost parts of Florida and California.
What do hardiness zones have to do with gardening?
Gardeners use hardiness zones as a reference point to determine which perennial plants will overwinter in their area, and as a general standard to gauge which annual plants will do well in a certain climate. Hardiness zones are also related to average last and first frost dates, an important factor in starting and transplanting annuals.
A press release by the Agriculture Research Service made the claim that “USDA’s Plant Hardiness Zone Map is the standard by which gardeners and growers can determine which plants are most likely to thrive at a location.”
The PZHM is an invaluable tool for any grower since plant-climate compatibility is one of the most important factors that determine success in the garden.
Why was the USDA map updated?
Temperature is one of the most significant external factors that influence plant growth, and it’s an ever-changing statistic.
To get the most accurate value, the team of researchers behind the PHZM collected weather data for 30 years and took the average of that data to map all 13 zones. It’s an ongoing process that will never be complete. There will always be more data to collect and a future revision that is more accurate.
What’s new about the 2023 USDA zone map
The previous version of the map was released in 2012, and compiled from data collected between 1976 to 2005, according to a USDA press release; it was also the first map to add zones 12 and 13.
One feature of the 2012 map that was kept for the 2023 version is the interactive Geographic Information System (GIS) feature that allows you to search for any area by zip code. Though exclusively available online, the updated map is free to use and download, making it accessible for growers and researchers everywhere.
The 2023 updated PHZM boasts a few significant differences from the 2012 map or any other prior version:
Increased data
Like its predecessor, the 2023 PHZM comes from the synthesis of 30 years of temperature data, collected between 1990 and 2020 by the PRISM Climate Group at Oregon State University. Unlike the 2012 map, the 2023 version uses significantly more weather stations to collect data—nearly twice as many as 2012. (A press release by the Agriculture Research Service (ARS) notes that the number of weather stations increased from 7,983 to 13,412, to be exact).
Improved technology
According to the ARS, one of the biggest improvements in the 2023 map is the detail that was added to Alaska. Previous iterations of the map featured a 6 ¼ -square-mile area of detail that the 2023 map shrinks to a ¼ square mile.
ARS Administrator Dr. Simon Liu remarked that “These updates reflect our ongoing commitment to ensuring the Plant Hardiness Zone Map remains a premier source of information that gardeners, growers, and researchers alike can use, whether they’re located in the continental United States, Alaska, Hawaii or Puerto Rico.”
Tips for Growers
The 2023 map also includes an added bonus for growers—a library of four YouTube videos featuring gardening-related topics. The videos are hosted by the USDA-ARS research programs and may be of interest to hobby gardeners and plant breeders. The videos are titled “How to Use the Maps,” “Weed Your Garden,” “Soil Health,” and “Gardening Tips.”
What the 2023 USDA PHZM means for growers
Increased data and improved technology—plus weather patterns over the last 30 years—have been the driving force behind the reassigning of hardiness zones. But how will that affect growers in 2023 and beyond?
Who is impacted?
Home gardeners may be the largest demographic to use the USDA PHZM (the ARS estimates that 80 million US-based growers use the map each year), but they’re not the only stakeholders affected by the recent changes in hardiness zones.
Farmers, plant nurseries, seed companies, landscaping businesses—anyone in the business of growing plants is likely to reference the PHZM on a regular basis. That includes people who study agriculture and horticulture.
A press release by the USDA specifically pointed out that scientists and researchers rely on the PHZM in their studies, too. “The USDA Risk Management Agency refers to the map’s plant hardiness zone designations to set certain crop insurance standards. Additionally, scientists incorporate the plant hardiness zones as a data layer in many research models, such as those modeling the spread of exotic weeds and insects.”
With the widespread changes to hardiness zones, all of these groups may have to adapt their work as a result of the new information.
Grower feedback
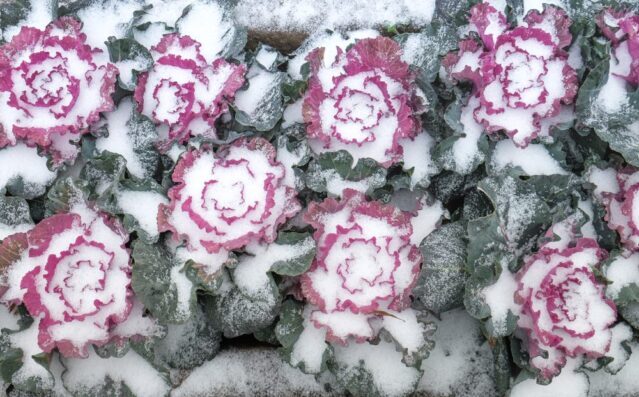
Placement in a warmer zone might imply that gardeners can grow more tropical plants than they’re used to and even start sowing seeds earlier in the year, but some growers are finding out that’s not the case. Even though historical data might average warmer annual wintertime temperatures, some folks are finding out that variable cold temperatures can still kill plants and set them back for the season.
While many gardeners are excited about the opportunity to grow plants that they wouldn’t have been able to based on outdated versions, even more growers aren’t the least bit surprised by the new map. The updates only confirm what they’ve already noticed to be true: climate zones are shifting, and have been since before 2012.
Still, some growers aren’t satisfied with the new map, even finding it inaccurate and confusing.
Gardening forums are full of comments by growers who feel like hardiness zones aren’t reliable anymore. Sure, the winter temperatures may have warmed on average, but more variable weather means that cold snaps can still come out of nowhere and kill sensitive plants. “I’ve had more success planting for a colder winter,” said Kaitte of Rocky Ford, Colorado in a comment on Almanac’s article on the new USDA map.
Several growers have decided that they know their gardens best and will plant according to their experience.
Pam Tippett commented on Gardener Scott’s YouTube video, The NEW Hardiness Zone Map (Explained), “My area was moved from 8b to 9a. I understand they use 30 years to come up with the averages, but my past couple of winters have actually been many degrees COLDER than average. I don’t think the zone change is going to impact my gardening plans. I’ll continue to make my gardening decisions based on the patterns and averages of my experience.”
Yet another concern with the new map is that it doesn’t account for warmer summertime temperatures and increased UV radiation, which also impacts plant growth. “The map deals with the hardiness temperatures for winter but doesn’t really address the increased stress on plants in a changing summer,” said another commenter on Gardener Scott’s video.
Researchers and plant experts don’t seem surprised at all by the new data.
What areas experienced the most change?
Heartland states
Although roughly half of the United States moved into a warmer hardiness zone, some areas experienced more change than others. The NYT article noted that the ‘Heartland’ region of the US seemed to warm the most. Arkansas, Kentucky, Missouri, and Tennessee experienced about a five-degree increase, on average.
Alaska
The USDA acknowledges parts of Alaska as changing the most—primarily because of the detail that was added to the Last Frontier. In a press release, the USDA outlines the more detailed resolution Alaska received on the map’s most recent revision. “Furthermore, the new map’s rendering for Alaska is now at a much more detailed resolution (down from a 6 ¼ -square-mile area of detail to a ¼ square mile).”
Cities
An interesting phenomenon the new map reveals is that urban areas tend to hold more heat than rural areas. Pavement, buildings, and vehicle exhaust can all contribute to a warmer microclimate in cities than rural areas. The ‘Map Creation’ tab explains that the new map, has a “higher level of resolution and can show smaller areas of zone delineations than earlier maps.” This enhanced technology and attention to detail, might place cities in a slightly warmer zone than the surrounding landscape.
High-elevation areas
The new map places areas at elevation in slightly colder zones than nearby regions closer to sea level. Mountain peaks are naturally colder and harsher climates than valleys, and the new map reflects this.
Areas bordered by water
Another important detail the new map considers is the effect that water has on temperature. Unfrozen bodies of water tend to warm any regions downwind, resulting in a milder winter climate than areas further inland.
Climate change and the 2023 USDA map
As for the question of climate change, the ARS refrains from linking the new PHZM to any conclusions of global warming.
“Temperature updates to plant hardiness zones are not necessarily reflective of global climate change because of the highly variable nature of the extreme minimum temperature of the year, as well as the use of increasingly sophisticated mapping methods and the inclusion of data from more weather stations,” an ARS press release reads.
The press release went on to explain that climate change is more accurately measured over longer time periods than the 30-year increments used to draw the PHZM.
Despite the ARS’ reluctance to draw conclusions that support climate change based on the hardiness zone studies, many people are linking the maps to global warming. Taken together, the 1990 version, 2012 version, and 2023 version show an overall warming trend.
Associated Press published an article titled, “New hardiness zone map will help US gardeners keep pace with climate change.” The article cites interviews with scientists who acknowledge the warmer winter temperatures all of us have been experiencing—particularly gardeners.
The New York Times published a similar article expressing concerns for a warming world, titled ”What Plants Will Survive in Your Garden? This Map Plans for a Warmer U.S.”
Dr. Christopher Daly, PRISM Climate Group director and lead researcher in the creation of the updated map said, “The addition of many new stations and more sophisticated mapping techniques using the latest PRISM technology led to a more accurate and detailed Plant Hardiness Zone Map but also produced localized changes that are not climate-related.”
The USDA reported that the new PHZM is roughly one-quarter-zone-warmer than the 2012 version, due to “a more recent averaging period,” as well as “additional data sources and improved interpolation methods.”
But not all changes in the 2023 map were from colder to warmer, the USDA explained on the ‘Map Creation’ page. Some areas actually reported colder temperatures than previous versions of the map.
Daly explained how the overall warming by 2.5 degrees played out in real-time: “This translated into about half of the country shifting to a warmer 5-degree half zone, and half remaining in the same half-zone.”
What does the new PHZM mean for your garden?
Just because the USDA released a new PZHM doesn’t mean everything will change overnight.
The 2023 USDA PHZM is not a forecast, but a reflection of trends that gardeners have already been seeing and adapting their gardening practices to for years. Will the new map offer a more precise understanding of minimum temperatures? Yes. For instance, your home may be situated in Zone 7B, while your church, just 30 minutes away, falls within Zone 6B. This slight geographical difference means there are certain plant varieties you may not risk overwintering at home, but would confidently do so at church. While gardeners are generally well-served by the primary zones, incorporating sub-zones into our system could enhance the growing experience.
By design, the USDA PHZM represents one data point (average lowest winter temperatures) and we know that plant growth is affected by several external and internal factors (genetics, sunlight, soil type, humidity, moisture, etc).
The 2023 USDA Plant Hardiness Zone Map is a useful tool but it isn’t necessarily the end-all-be-all. If you like, plant something inside your new hardiness zone next growing season, but be prepared to lose it, too. You know your garden better than anyone, so trust your intuition to know what to grow and when to start seeds.
And don’t forget to shop the Eden Brothers Online Store for seeds, bulbs, and tubers—whether you’re sticking to what you know or trying something new!